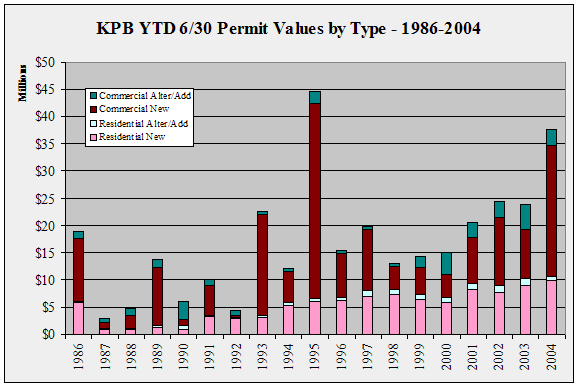
| KPB YTD 6/30 Permit Values by
Type - 1998-2004 - in $ |
| |
1998 |
1999 |
2000 |
2001 |
2002 |
2003 |
2004 |
Annual
Change |
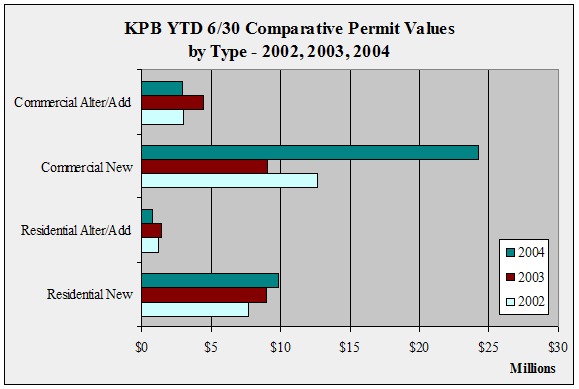
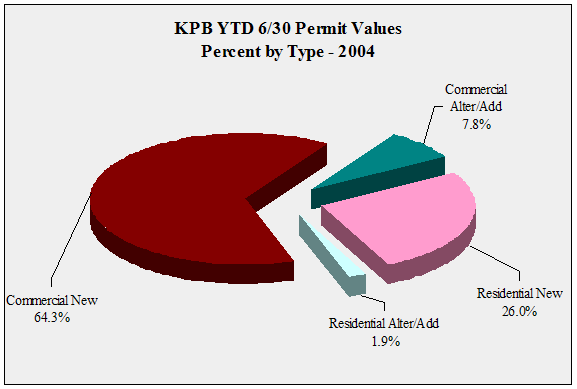
| Residential
New |
7,255,000 |
6,427,674 |
5,774,460 |
8,290,801 |
7,677,362 |
8,966,634 |
9,831,284 |
9.6% |
| Residential
Alter/Add |
973,443 |
849,161 |
879,074 |
1,115,639 |
1,204,334 |
1,378,207 |
723,642 |
-47.5% |
| Commercial
New |
4,186,190 |
5,091,318 |
4,233,395 |
8,343,378 |
12,670,311 |
9,037,210 |
24,253,641 |
168.4% |
| Commercial
Alter/Add |
601,842 |
1,892,859 |
4,057,549 |
2,859,969 |
2,959,897 |
4,437,046 |
2,933,663 |
-33.9% |
| Total |
13,016,475 |
14,261,012 |
14,944,478 |
20,609,787 |
24,511,904 |
23,819,097 |
37,742,230 |
58.5% |
| Annual
Change |
|
9.6% |
4.8% |
37.9% |
18.9% |
-2.8% |
58.5% |
|
|